PupperPy
Codename: CERBARIS
Software for the control and management of the Stanford Pupper Robot
Project maintained by nubs01 Hosted on GitHub Pages — Theme by mattgraham
Introduction | Team | Hardware | Software Overview | Software Setup | Computer Vision | Collision Avoidance | Web Interface | Odometry | Behavioral Control |
Web Interface
The web interface is accessible at https://cerbaris.netlify.app.
Overview
The web interface displays data about the robot’s current state in real time. This includes data from the object sensors and IMU, as well as the bounding box detected from computer vision and the current behavior of the robot. The goal of the web interface was to be able to easily visualize what data the robot was receiving from both the control code and sensors for debugging purposes. In addition, because of lab and campus restrictions, it was sometimes easier to watch the robot remotely from the web interface rather than go to the robotics lab.
Software architecture
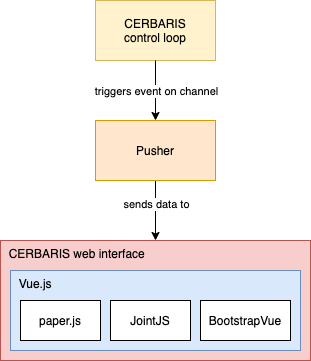
The biggest challenges in coding the web interface were
- realtime communication between the website and an external script
- creating visual diagrams based on received data
The first challenge was solved by using an external service called Pusher, while the second required using a mix of different JavaScript frameworks and libraries - mainly Vue.js, paper.js, and JointJS.
Real-time updates
To push updates to the web interface in real time, we used Pusher. With Pusher, we can send data directly from the python code to the web interface in two steps. First, we trigger an event from python:
# PusherInterface.py
self.client.trigger('sensor_data', 'new', {
  'timestamp': message['time'],
  'yaw': message['yaw'],
  # ... etc
}
Using the app-specific keys in the .env file, this triggers the new event on the sensor_data channel with the given data. In the second step, this data is received on the JavaScript side:
// SensorPanel.vue
const pusher = new Pusher(process.env.VUE_APP_PUSHER_KEY, {
  cluster: process.env.VUE_APP_PUSHER_CLUSTER,
});

const channel = pusher.subscribe('sensor_data');
channel.bind('new', this.update);
Here, the sensor panel is subscribing to any messages on the new event of the sensor_data channel. When a message is received, the update function is called, which updates the diagrams and data tables with the new information.
Vue.js
We used a frontend framework called Vue.js for the web interface. Vue is component-based, so it works well for something like the CERBARIS Dashboard, which needed to have several panels displaying different types of information. Each component defines a visual subsection of the interface:
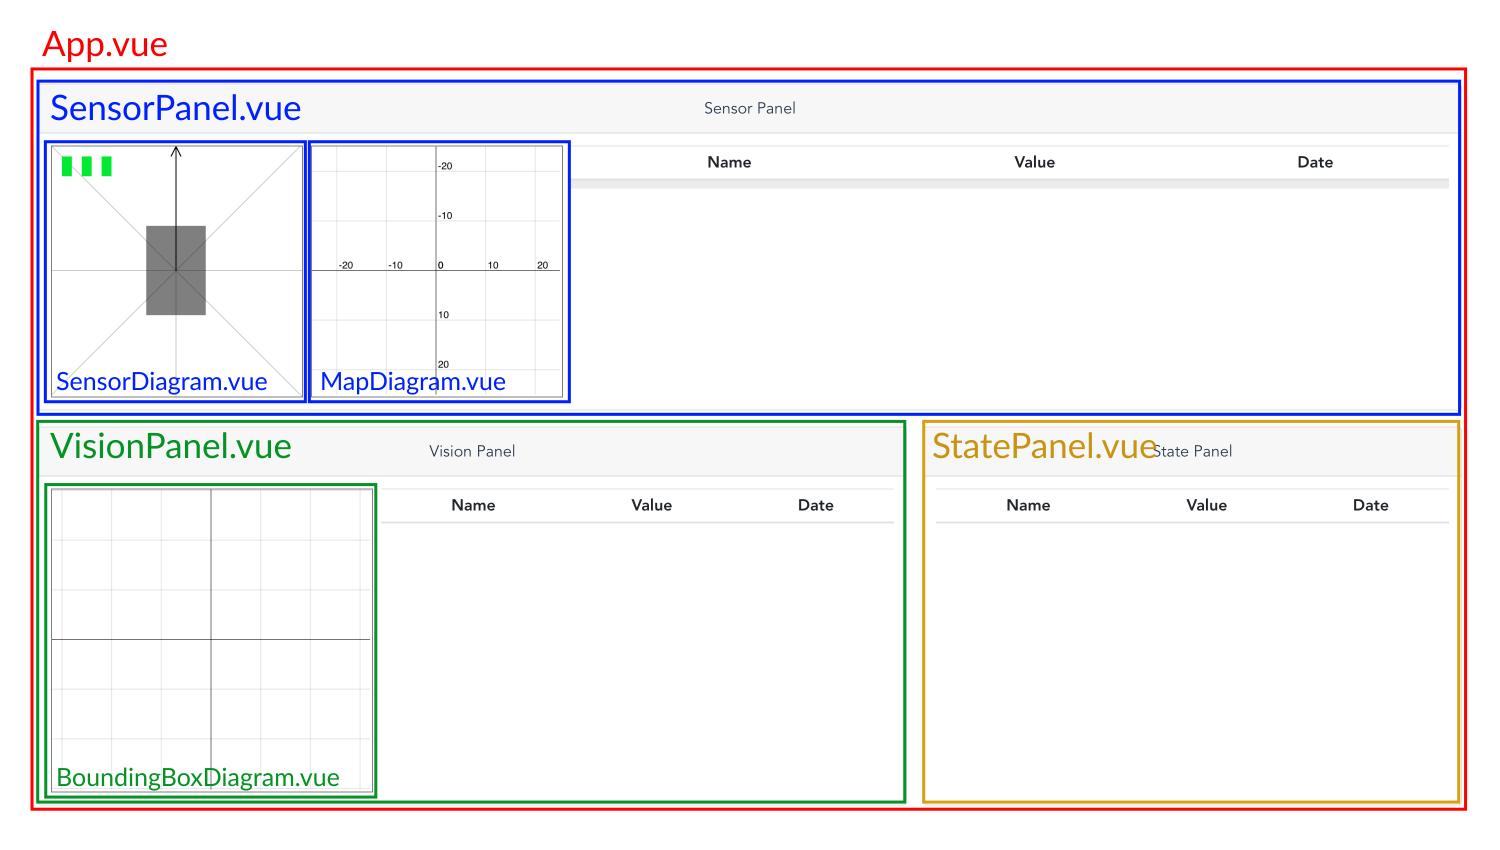
By separating the web interface into components early on, we were able to enforce modularity into the frontend code. Vue also enforces a certain style of communication between components, moving from parent to child.
Sensor and bounding box diagrams
The diagrams on the main page of the web interface were created using paper.js, which is a library that builds on the JavaScript Canvas API. Using paper.js, we created diagrams out of simple shapes that change color, rotation, scale, or position depending on the current state of the robot. These are discussed in greater detail in the following sections:
Behavior tree diagram
One goal of the project was to be able to describe and modify the behavior of the robot using behavior trees. To reflect this on the web interface, we developed an interactive graph using a JavaScript library called JointJS.
With JointJS, the canvas is split roughly into three parts: elements, or nodes of the graph; links, or edges that connect nodes; and blank, or empty parts of the canvas. First, we built a tokenizer and parser to convert a text file representing behavior tree into a JointJS graph. Then, using pointer and key events, we made the graph interactive, so that a user can create, delete, and edit different parts of the graph.
Bootstrap
We used a Vue wrapper around the CSS framework Bootstrap (called BootstrapVue) to quickly style the web interface. Bootstrap has useful HTML elements, such as Cards, that come essentially pre-styled. It also uses HTML classes to determine the styles applied to an element, which makes styling responsively much easier.
<!-- SensorPanel.vue -->
<b-card-body class="panel-body d-flex justify-content-center flex-wrap flex-lg-nowrap p-2">
  <sensor-diagram class="m-1" :sensor-data="sensorData" :yaw="yaw" :timestamp="timestamp"></sensor-diagram>
  <map-diagram class="m-1" :pos-data="posData" :timestamp="timestamp"></map-diagram>
  <b-table hover sticky-header small class="m-1 flex-fill" style="max-height: 250px" :items="dataTable"></b-table>
</b-card-body>
In this code snippet, we use the BootstrapVue element b-card. The b-card-body element has classes d-flex, flex-wrap, and flex-lg-nowrap. This means that the element will be displayed using flex, and will wrap for screens smaller than large (width 1200 pixels and up).
Code design
Here, we explain in detail the most interesting parts of the web interface code.
PusherInterface.py
PusherInterface.py contains a class called PusherClient with a single method send, which is used to send data from the python script. The data is separated into four channels within the send method:
sensor_data: object sensor data and IMU (position, velocity, and acceleration) datavision_data: bounding box size, position, label, and confidencestate_data: state name and velocity/yaw commandstree_data: behavior tree and active node
We chose to separate the data into these four channels, rather than combining them into one and separating the data in the frontend. This was to allow the panels to update independently of each other; we wanted the web interface to eventually be able to accommodate updating different sections of the data at different times and frequencies. In addition, the Pusher documentation suggests separating by channels rather than events or within the frontend for performance purposes.
Vue component structure
Every Vue component has a template section and script section. The template section is similar to HTML, while the script section is JavaScript. More details on the Vue component structure can be found in the official Vue guide, which we highly recommend working through before trying to write your own components.
Sensor diagram
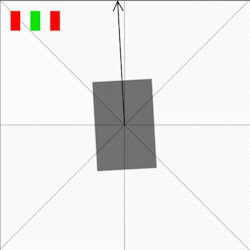
The sensor diagram receives the object sensor data and the robot’s yaw. It visualizes the object sensor data using three rectangles which change color depending on whether the corresponding object sensor is currently sensing something. The three rectangles are initialized as follows:
// SensorDiagram.vue
let sensor_w = 10
let sensor_h = 2 * sensor_w
this.leftSensor = new Path.Rectangle({
  point: [10, 10],
  size: [sensor_w, sensor_h],
  fillColor: 'rgba(15, 234, 0)',
  opacity: 1,
})
// ... etc.
Their colors are then updated by calling the updateRangeSensor method.
// SensorDiagram.vue
updateRangeSensor(sensor, value) {
  if (value) {
    sensor.fillColor = 'red'
  } else {
    sensor.fillColor = 'rgba(15, 234, 0)'
  }
}
The sensor diagram visualizes the robot’s yaw as a rotating rectangle with an arrow. First, radial axes are drawn to give the user an intuition for the yaw value.
// SensorDiagram.vue
let num_axes = 8
for (let i = 0; i < num_axes; i++) {
  let axis = new Path.Line({
    from: [this.width/2, this.height/2],
    to: [this.width/2, -this.height],
    strokeColor: 'black',
    opacity: .2
  })
  axis.rotate(i * 360 / num_axes, new Point(this.width/2, this.height/2))
}
Then, the robot (gray box) and arrow are drawn and grouped.
// SensorDiagram.vue
// forward arrow
let arrow_w = 10
let arrow_h = 10
let forward_arrow = new Path.Line({
  from: [this.width/2, this.height/2],
  to: [this.width/2, 0],
  strokeColor: 'black',
})
forward_arrow.add({point: [this.width/2 - arrow_w/2, arrow_h]})
forward_arrow.add({point: [this.width/2, 0]})
forward_arrow.add({point: [this.width/2 + arrow_w/2, arrow_h]})
// robot body
let robot_w = 60
let robot_h = 1.5 * robot_w
let robot = new Path.Rectangle({
  point: [(this.width - robot_w) / 2, (this.height - robot_h) / 2],
  size: [robot_w, robot_h],
  fillColor: 'black',
  opacity: .5,
})
// robot group
this.robotGroup = new Group([forward_arrow, robot])
Grouping the arrow and robot body makes changing their rotation very easy.
// SensorDiagram.vue
updateYaw() {
  if (this.yaw == null) return
  this.robotGroup.rotate(-this.robotGroup.rotation, new Point(this.width/2, this.height/2))
  this.robotGroup.rotate(this.yaw, new Point(this.width/2, this.height/2))
}
Map diagram
The most difficult part of drawing the map diagram was making sure that the robot’s position could not go out of the diagram’s bounds. To do this, we implemented an automatic scaling mechanism by keeping track of the bounds of the robot’s current and past positions.
// MapDiagram.vue
calcMapBounds() {
  // recalculate mapBounds
  if (this.posData.x < this.mapBounds.xMin ||
    this.posData.x > this.mapBounds.xMax ||
    this.posData.y < this.mapBounds.yMin ||
    this.posData.y > this.mapBounds.yMax) {

    this.mapBounds = {
      xMin: Math.min(this.posData.x, this.mapBounds.xMin),
      xMax: Math.max(this.posData.x, this.mapBounds.xMax),
      yMin: Math.min(this.posData.y, this.mapBounds.yMin),
      yMax: Math.max(this.posData.y, this.mapBounds.yMax),
    }
  }
}
Then, we calculate the scale that the map needs to be to keep the robot’s current and past positions within the bounds of the diagram.
// MapDiagram.vue
this.scale = Math.min(this.minScale,
  (this.origin.y - this.margin) / (this.mapBounds.yMax || 1),
  (this.margin - this.origin.y) / (this.mapBounds.yMin || -1),
  (this.origin.x - this.margin) / (this.mapBounds.xMax || 1),
  (this.margin - this.origin.x) / (this.mapBounds.xMin || -1))
If the scale has changed, then we clear and redraw the diagram. Then we update it with the robot’s new position.
// MapDiagram.vue
this.reset() // clears and redraws the axes with correct scale
this.drawPath() // draws the path that the robot has taken from past to present - 1
this.drawPos() // draws the robot's current position
Bounding box diagram
The bounding box diagram receives the x and y positions of the upper left corner of the bounding box, as well as its width and height. Using this information, we can clear the previous bounding box and draw the new one each time new data is received.
// BoundingBoxDiagram.vue
drawBoundingBox() {
  this.scope.activate()
  if (this.bbox) {
    this.bbox.remove()
  }
  this.bbox = new Path.Rectangle({
    point: [this.bboxData.x, this.bboxData.y],
    size: [this.bboxData.w, this.bboxData.h],
    fillColor: 'red',
    opacity: .4,
    strokeColor: 'black',
  })
  console.table('bounding box delay: ' + Math.trunc(Date.now() - this.timestamp * 1000) + 'ms')
}
Behavior tree
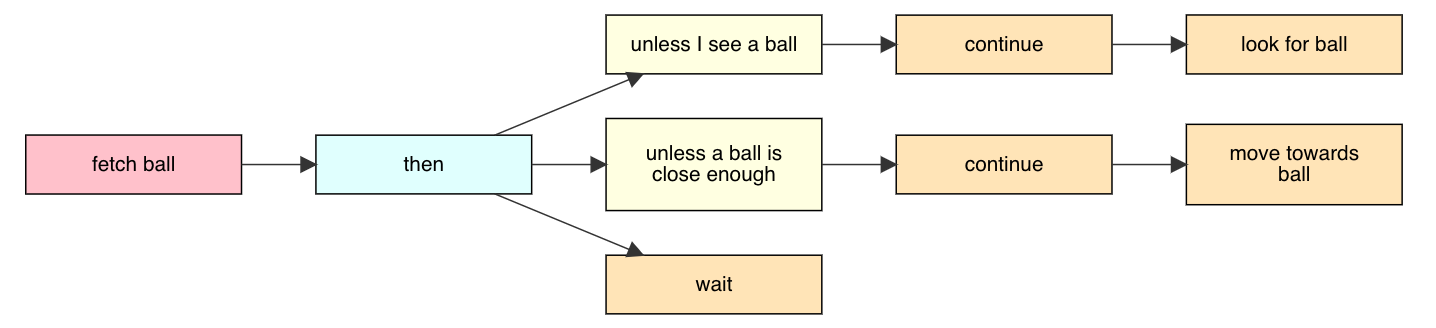
As mentioned before, we used JointJS to create an interactive behavior tree. What follows is a technical description of how the various functions of the behavior tree work.
Tokenizing & parsing the text file
The text representing the behavior tree is given in the following format, where an increase in the number of tabs before a line indicates that it is a child node of the above line.
fetch ball
  then
    unless I see a ball
      continue
        look for ball
    unless a ball is close enough
      continue
        move towards ball
    wait
The first step of processing this text is tokenization. Each line is broken into three pieces of information: its value (text), node type (conditionals, actions, etc), and number of tabs. The lines are stored in a list in the same order as they were in the text file.
// TreeDiagram.vue
tokenize(text) {
  let lines = text.split('\n')
  let tokens = []
  tokens.push({tabs: -1, value: null}) // root

  lines.forEach(line => {
    if (line.trim().length === 0) {
      return
    }
    let tabs = line.lastIndexOf('\t') + 1
    let value = line.trim()
    let type = this.determineType(tabs === 0, value) // determines the node type
    tokens.push({tabs, value, type})
  })
  return tokens
}
Next, the list of tokens is parsed into a tree format using JavaScript objects. The general structure of the resulting tree is
{
  value: 'value of parent node'
  type: 'type of parent node'
  children: [
    {
      value: 'value of child node',
      type: 'type of child node',
      children: [
        // ... etc.
      ]
    },
    // ... etc.
  ]
}
This structure is created using the recursive method parseTree, which takes in the list of tokens returned from tokenize and the current index within that list (starting at 0), and returns a node in the above format representing the current token (including all of its children).
// TreeDiagram.vue
parseTree(tokens, index) {
  let node = {
    value: tokens[index].value,
    type: tokens[index].type,
  }
  // base case: leaf node; no next elt or next elt's tabs <= curr elt's tabs
  if (tokens.length <= index + 1 || tokens[index + 1].tabs <= tokens[index].tabs) {
    node.children = []
    return node
  } else {
    // loop through children and call recursively
    let childIndex = index + 1
    let children = []
    while (childIndex < tokens.length && tokens[childIndex].tabs > tokens[index].tabs) {
      if (tokens[childIndex].tabs === tokens[index].tabs + 1) {
        children.push(this.parseTree(tokens, childIndex))
      }
      childIndex++
    }
    node.children = children
    return node
  }
},
The base case occurs if the current token is a leaf node, which means that either the subsequent token has fewer tabs than the current token, or the current token is the last token in the list. In the recursive case, we loop through the children of the current token and call parseTree on each one, adding the resulting node for each child into a list. This list is assigned to the children key of the current node. The current node is then returned.
Drawing the tree
The tree is drawn by calling the method drawTree, which initializes the paper and graph that JointJS requires. Then it calls drawNode, which takes in the JointJS graph object, JointJS parent element, and JavaScript object representing the current node.
// TreeDiagram.vue
drawNode(graph, parent, nodeObj) {
  let node = new joint.shapes.standard.Rectangle()
  // style node and add label
  this.styleNode(node, nodeObj.value, nodeObj.type)
  // draw self
  if (nodeObj.value !== null) {
    node.addTo(graph)
    this.nodeList.push(node)
  }
  // draw link
  if (parent && parent.attr('label/text').length > 0) {
    let link = new joint.shapes.standard.Link()
    link.attr('line/strokeWidth', 1)
    link.source(parent)
    link.target(node)
    link.addTo(graph)
  }
  // draw children
  nodeObj.children.forEach(child => {
    this.drawNode(graph, node, child)
  })
}
drawNode recursively travels through each node and its children, drawing the appropriate element and the link between itself and its parent for each node. Note that when drawing links, JointJS requires both the parent node (source) and child node (target) of the link to be already added to the graph.
Serializing the tree
Serializing the tree is also recursive and works very similarly to drawing and parsing the tree. However, because sibling order matters, the y-coordinate of each sibling node is taken into account when deciding the line order in the resulting string.
// TreeDiagram.vue
children.sort((firstElt, secondElt) => firstElt.get('position').y - secondElt.get('position').y)
If the y-coordinate of Node A is less than its sibling Node B, then Node A’s text will be placed before Node B’s text in the final string.
User interaction
There are three ways a user can interact with the graph: adding, removing, and editing. The user can add an element by shift-clicking and dragging on an existing node, which will add a child node to the existing one. They can also shift-click and drag on the blank canvas, which will add a parent-child node pair. The user can remove elements by alt-clicking on them; this works for both nodes and edges. Finally, the user can edit the text on an existing node by double-clicking on the node, which will bring up a prompt for the user to enter the new text. All of these user interactions are coded using JointJS’s built-in events.
// TreeDiagram.vue
paper.on('element:pointerdown', (elementView, evt, x, y) => {
  if (evt.shiftKey) {
    // prevent element from being dragged
    elementView.options.interactive = false
    let width = 145
    let height = 50
    let child = new joint.shapes.standard.Rectangle({
      position: { x: x - width/2, y: y - height/2 },
      size: { width, height },
    })
    this.styleNode(child, 'new node', 'blank')
    child.addTo(this.graph)
    evt.data.draggedElement = child
    // create link
    let link = new joint.shapes.standard.Link()
    link.attr('line/strokeWidth', 1)
    link.source(elementView.model)
    link.target(child)
    link.addTo(this.graph)
  } else {
    elementView.options.interactive = true
  }

  if (evt.altKey) {
    elementView.model.remove()
  }
})

paper.on('element:pointermove', (elementView, evt, x, y) => {
  if (evt.data.draggedElement) {
    let {width, height} = evt.data.draggedElement.get('size')
    evt.data.draggedElement.set('position', {x: x - width/2, y: y - height/2})
  }
})
These two events handle both removing a node by alt-clicking and adding a child node to an existing one by shift-clicking and dragging. When we call paper.on(), we give it two arguments: the name of the event, and the function to call when the event is triggered. This means that when the pointerdown event is detected on an element (aka node), we check if the shift key is also being pressed. If so, we create the new child node and link connecting the current node and the new node. As the mouse is dragged around the canvas, the pointermove event is repeatedly triggered. So, the second call to paper.on() comes into play; it causes the new node to be dragged around with the movement of the mouse. Note that the dragged element is passed from the pointerdown to the pointermove callback functions using the evt.data object, similar to this example from the JointJS docs.
What we would do next
We have several ideas for improving and further developing the web interface.
Create a backend
Currently, the web interface is a static website, meaning that it has no backend. A backend could be used for storage and as an API. Storing all messages going through Pusher would be helpful for debugging both the web interface and the robot itself. The stored messages could also be used to replay past runs.
Web sockets
We are currently using the external Pusher service to pass information from python scripts to the frontend. Instead, we might consider coding web sockets manually. (Pusher likely uses web sockets or a similar mechanism behind-the-scenes.) This could be not just an interesting exercise, but also increase our flexibility in terms of which parts of the architecture are able to act as a server (sending data) or client (receiving data). Unfortunately, Pusher has limited client/server libraries, which makes communication from the frontend JavaScript to the python scripts more difficult than the other way around. As an alternative to creating web sockets from scratch, future developers could research how existing Pusher libraries work and contribute to Pusher by creating a server library for JavaScript.
Improve behavior tree support
It would be really cool to be able to modify the robot’s behavior by modifying its behavior tree on the web interface. This would require communication from the JavaScript frontend to the python scripts, which is not yet set up.
In addition, allowing both user interaction and active node highlighting could cause a conflict. One fix for this potential problem could be pausing active node highlighting while the user is editing the graph, until the user’s edits are reflected in the robot’s behavior.
Add routes
The web interface is currently a single-page application (SPA). If we wanted to add more functionality on other routes (other than the home route), it might become necessary to convert it into a multi-page application instead, or use the Vue router to artificially create routes.
Notes for future developers
Pusher
Pusher requires using environment variables, which depend on the Pusher app that you will be pushing data to and receiving data from. Future developers will likely want to create their own production and development apps, which means creating multiple environment files. We suggest putting one called .env in pupperpy that contains PUSHER_APP_ID, PUSHER_KEY, PUSHER_SECRET, and PUSHER_CLUSTER for both the production and development apps. You can comment out the lines for the app that you don’t want to be sending data to. Then you can add two environment files called .env.development.local and .env.production.local in web/cerbaris-client that contain VUE_APP_PUSHER_KEY and VUE_APP_PUSHER_CLUSTER for the development and production apps, respectively. Vue will automatically insert the development environment variables when running locally (npm run serve) and the production environment variables for deployment (npm run build). See the Pusher docs and Vue docs on environment variables for more information.
Netlify
We used Netlify to deploy the frontend app; however, any static website deployment service would work. For some ideas, check this guide from Vue or search for how to deploy a static website.